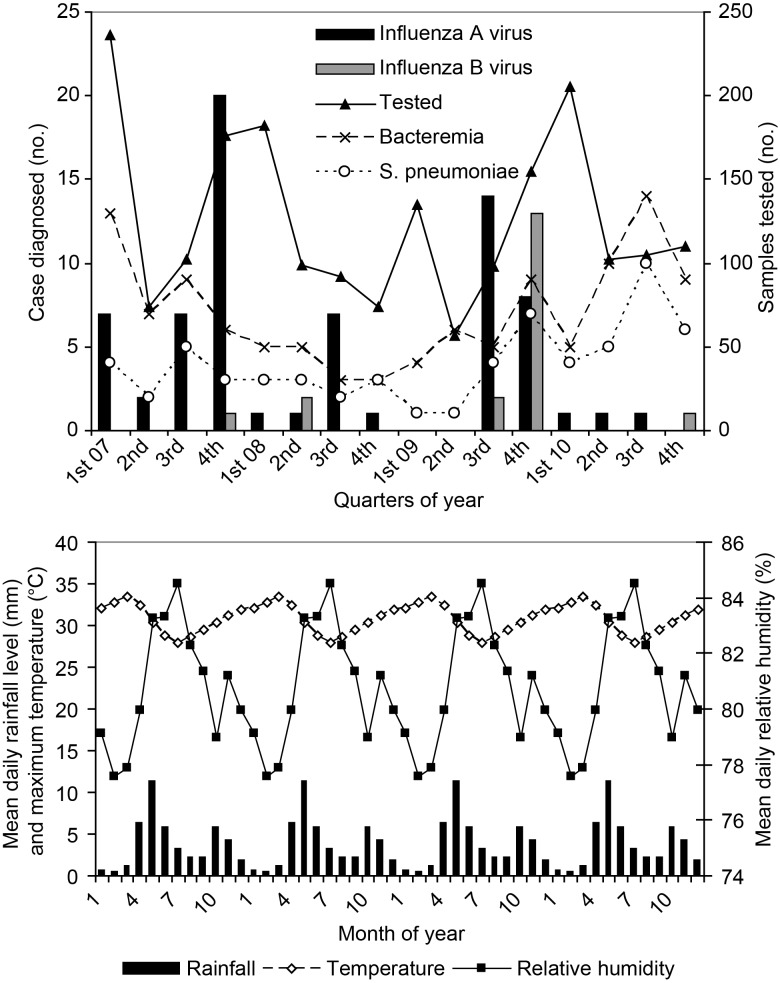
Figure 1.
Temporal distribution, by quarter, of molecular diagnoses of influenza A virus infection (dark bars) and influenza B virus infection (light bars) in nasopharyngeal samples collected from children with severe or very severe pneumonia who were admitted to Kilifi District Hospital, 2007–2010. Also, on the same axis are shown the quarterly number of admissions with bacteremia (x markers) and S. pneumoniae (o markers). The numbers of nasopharyngeal swab specimens collected each quarter are shown on the secondary Y axis (triangle markers). B, Monthly weather patterns averaged during 2007–2010.

