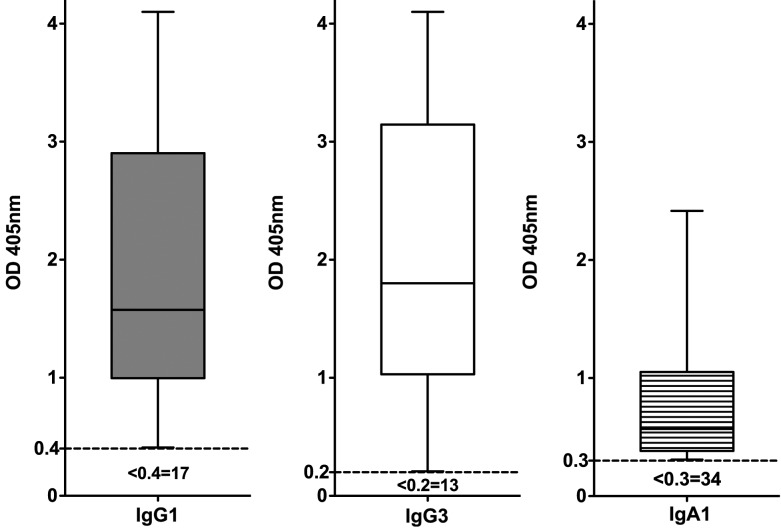
Figure 1.
Seropositivity and immunoglobulin subclass-specific responses in patients with current genital Ct infection. Serum samples from 98 patients with current genital Ct infection (group 1) were analyzed using EB ELISA. Data for positive serum samples only are presented as box-and-whiskers graphs of OD405 values. The box extends from the 25th percentile to the 75th percentile, with the median response indicated by the horizontal line within the box. Whiskers represent the range of responses from minimum to maximum for positive serum samples. The broken line (---) indicates the cutoff OD value for a positive response. The number of patients who tested negative for a given response is indicated beneath the cutoff line. IgG1 (shaded boxes), IgG3 (open boxes), and IgA1 (lined boxes) responses are indicated on the graph.

