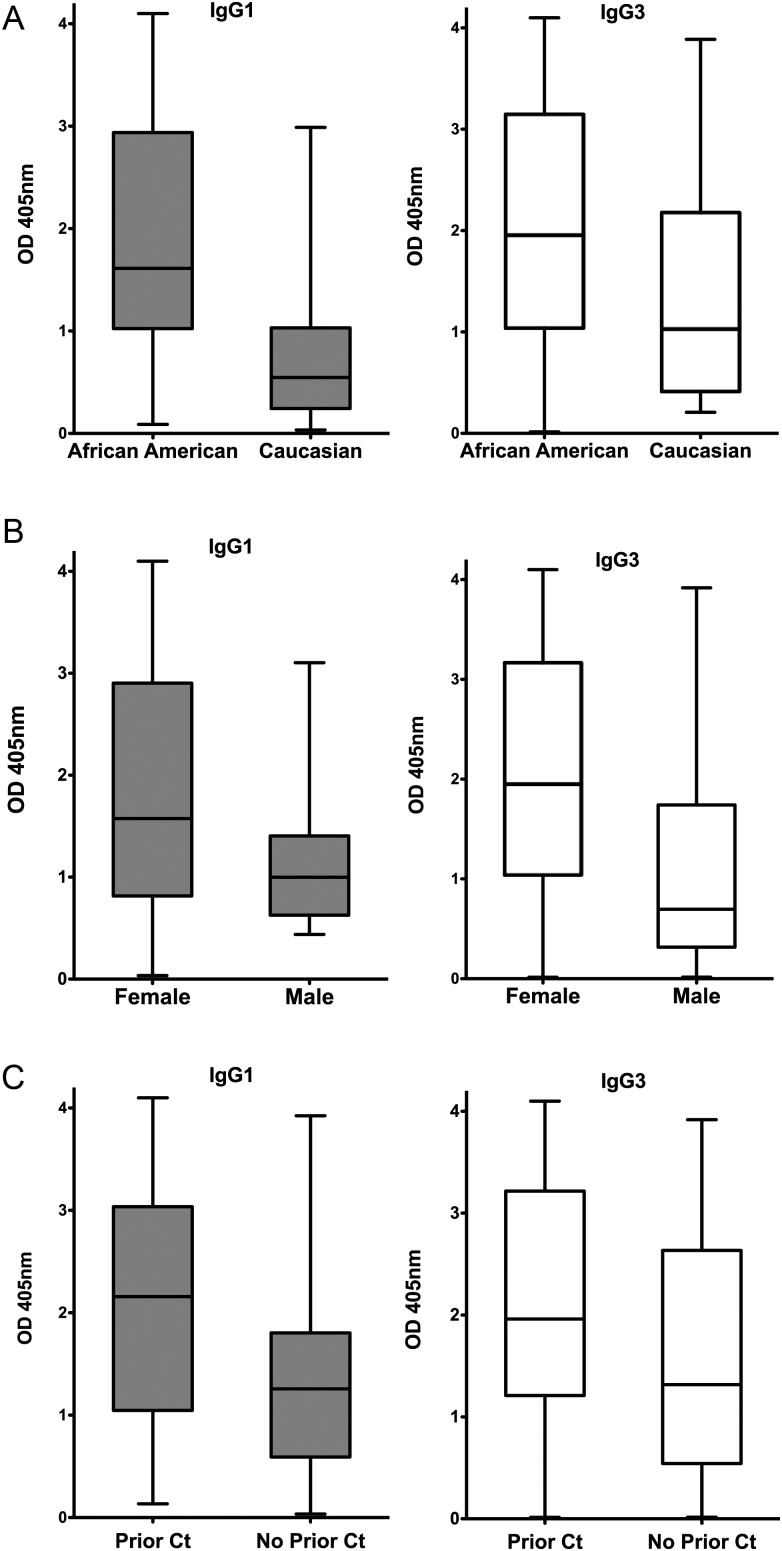
Figure 2.
Effect of race, sex, and prior Ct infection on IgG1 and IgG3 Ct EB ELISA responses. The IgG1 and IgG3 CT EB ELISA responses of the 88 seropositive patients from group 1 (patients with current genital Ct infection) were compared to assess differences in responses between (A) African American vs white patients (IgG1: median OD, 1.61 vs 0.55 [P < .001]; IgG3: median OD, 1.96 vs 1.03 [P = .048]); (B) female vs male patients (IgG1: median OD, 1.58 vs 1.00 [P = .082]; IgG3: median OD, 1.95 vs 0.7 [P = .018]); and C, subjects with vs without prior Ct infection (as assessed by self-report or clinic record review); IgG1: median OD, 2.16 vs 1.26 [P = .013]; IgG3: median OD, 1.96 vs 1.32 [P = .029]). Data are presented as described in Figure 1 legend.

