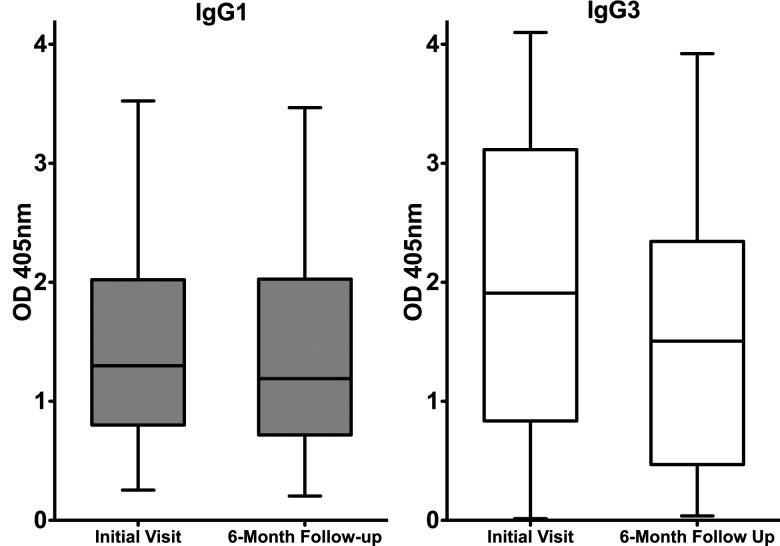
Figure 3.
Comparison of IgG1 and IgG3 Ct EB ELISA responses at the initial and 6-month follow-up visits. Data represent OD405 values of serum samples from 28 patients with current genital Ct infection who were seropositive at baseline and who had serum samples collected at a 6-month follow-up visit. Data are presented as described in Figure 1 legend. No statistically significant difference was found in the magnitude of the median IgG1 response of serum samples collected at the time of the initial visit and at 6 months after infection diagnosis and treatment (IgG1: median OD, 1.30 vs 1.20; P = .67), but the median IgG3 response decreased slightly during that period (IgG3: median OD, 1.90 vs 1.50; P = .015).

