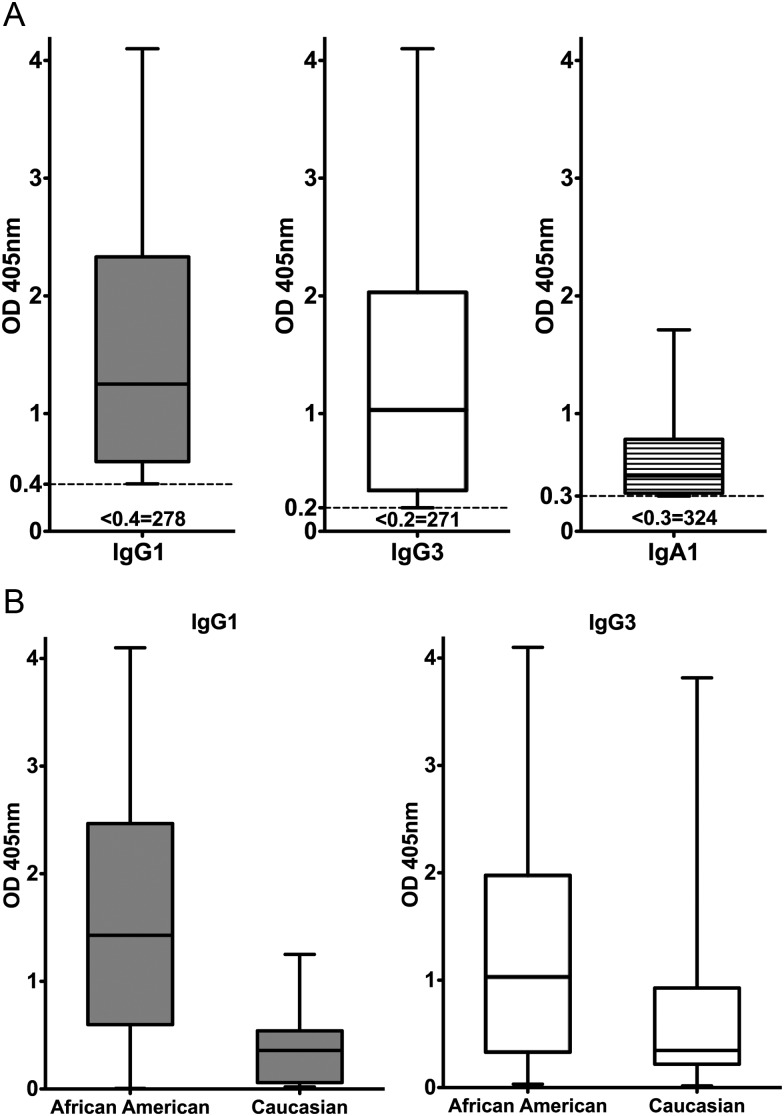
Figure 4.
Ct seropositivity and immunoglobulin subclass-specific responses in patients with unknown chlamydia infection status (group 2). The study population consisted of 367 adult females whose prior and current Ct infection status was unknown. Data are presented as described in Figure 1 legend. (A) the IgG1, IgG3, and IgA1 Ct EB ELISA responses of seropositive patients. The number of patients testing seronegative for each specific Ig subclass is indicated below the positive OD cutoff value. (B) comparison of IgG1 and IgG3 responses of seropositive group 2 African American vs white patients (total of 112 IgG1 or IgG3 seropositive patients; IgG1: median OD, 1.43 vs 0.36 [P < .001]; IgG3: median OD. 1.03 vs 0.35 [P = .011]).

