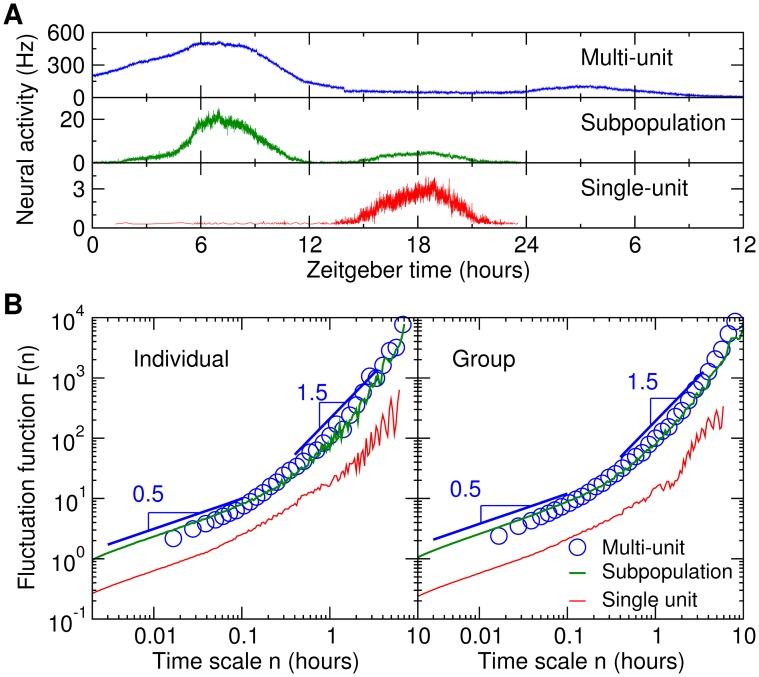
Figure 3. Single unit and subpopulation neural activity of in vitro SCN possess the same non-fractal fluctuation patterns as observed in in vitro multi-unit activity.
(A) Examples of single unit, subpopulation, and multi-unit neural activity within the in vitro SCN of the same mouse. The recordings were selected to reflect the possibility that single-unit, subpopulation, and multi-unit data could show different circadian profiles as described before [18], e.g., the single-unit data peaked at Zeitgeber time 18 hours; the subpopulation data peaked at 7 and 18 hours, respectively; and the multi-unit activity peaked at 7 hours and 3 hours, respectively. (B) The fluctuation functions of the individual recordings (shown in panel A), and the group averages. Data were shown in log-log plots. The form of the function was almost identical for single-unit and subpopulation data as well as for the MUA recordings except for a vertical shift which indicates an expected difference in mean fluctuation amplitude. The subpopulation data were obtained from the analysis of action potentials with the target average firing rate of 10 Hz in the 30-minute windows centered at the peaks of MUA (see Methods). The form remained the same for different subpopulation data with different target average firing rate at MUA peak(s). The multi-unit results were vertically shifted for a better visualization of the similar non-power-law form as compared to single-unit and subpopulation results.

