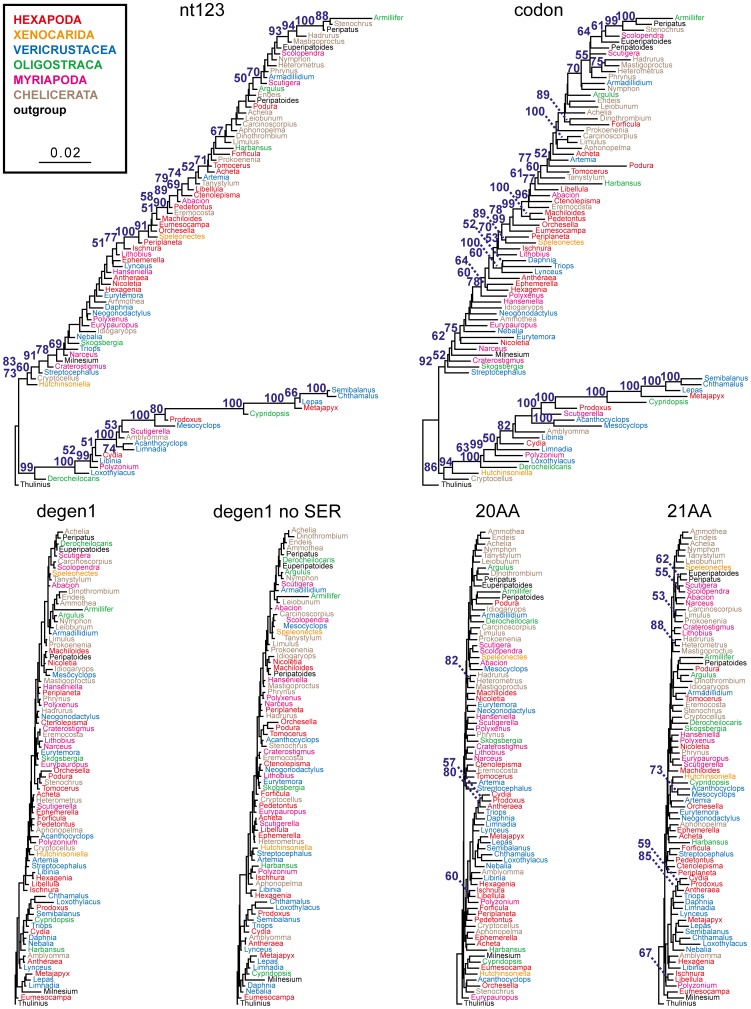
Figure 3. Compositional distance trees (Euclidean distances) for six data sets – nucleotide composition for nt123 data set, degenerated nucleotide composition for degen1 data sets with and without serine, codon composition for codon data set, and amino acid composition for 20AA and 21AA data sets.
Bootstrap percentages >50% are displayed and indicate the strength of the compositional signal at particular nodes. The sum of all branch lengths reflects the total amount of compositional heterogeneity in the data set.

