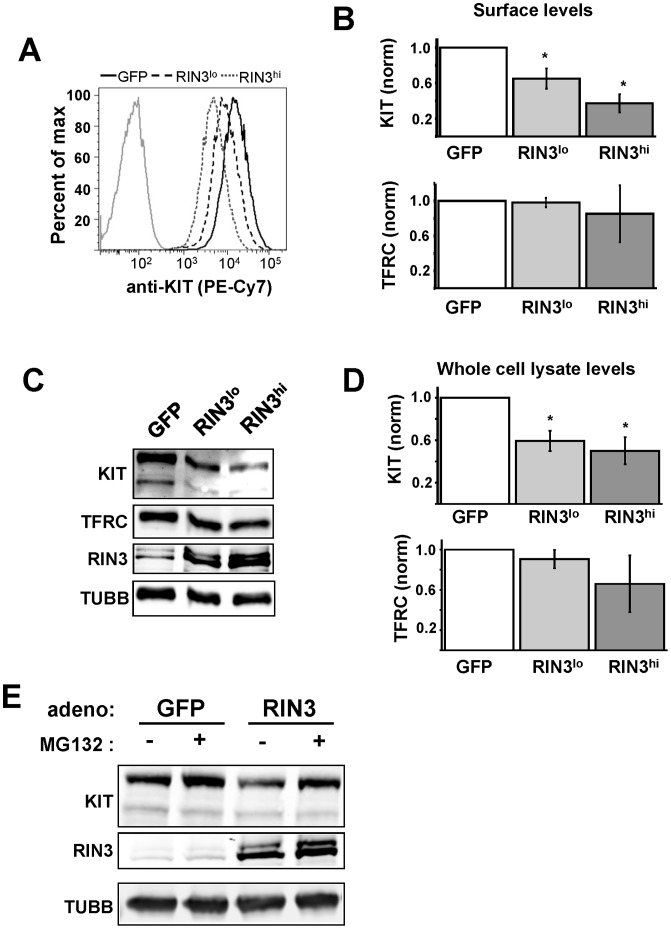
Figure 5. KIT down regulation is enhanced by RIN3 activity.
(A) Cells infected with Ad-GFP (black line) or Ad-RIN3 at high (dotted line) and low (dashed line) concentrations were stained with PE/Cy7 labeled anti-KIT and analyzed by flow cytometry for basal surface expression of KIT. Gray line represents unstained control. (B) Graphs showing surface intensity of anti-KIT and anti-TFRC as determined by flow cytometry. Surface expression of GFP transduced cells was set to one. Data are compiled from two independent experiments, *p<0.05. (C) Lysates from cells from A and B were immunoblotted to determine the amount of RIN3 over-expression and basal KIT and TFRC levels. (D) Graphs showing intensity of immunoblot signal for KIT and TFRC compiled from two separate experiments, *p<0.05. (E) The proteasome inhibitor MG132 partially restores KIT expression. Immunoblot for KIT levels in cells incubated for 3 hours with vehicle (ethanol) or 10 µM MG132 after overnight SCF starvation. This immunoblot is representative of two independent experiments; KIT levels increased by 24.5±12.5% for GFP infected cells and 47.5±3.5% for RIN3 infected cells.

