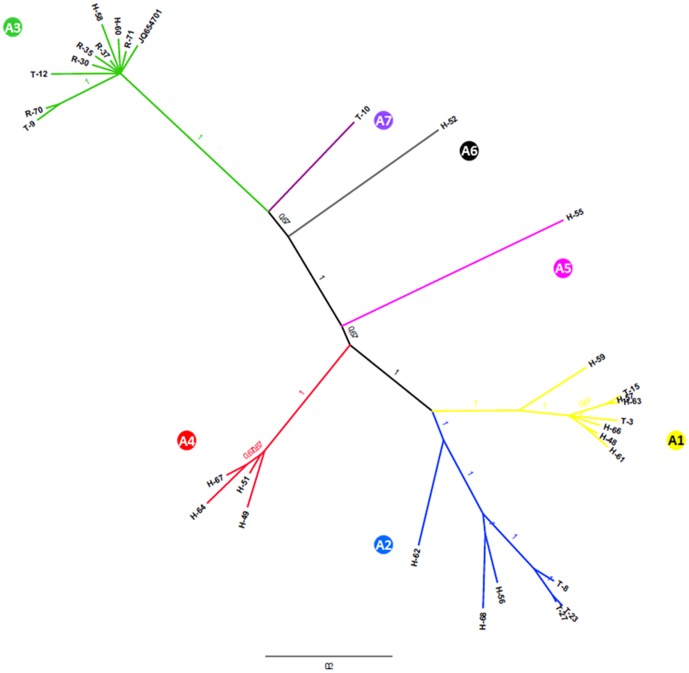
Figure 3. Bayesian phylogenetic analysis of the partial NS5 protein gene sequences (933 bp) from human, tick and rodent samples in Slovenia.
Branch labels represent posterior probabilities. Sample information is given in Table 1. Designations A1–A7 represent the determined phylogenetic clusters.

