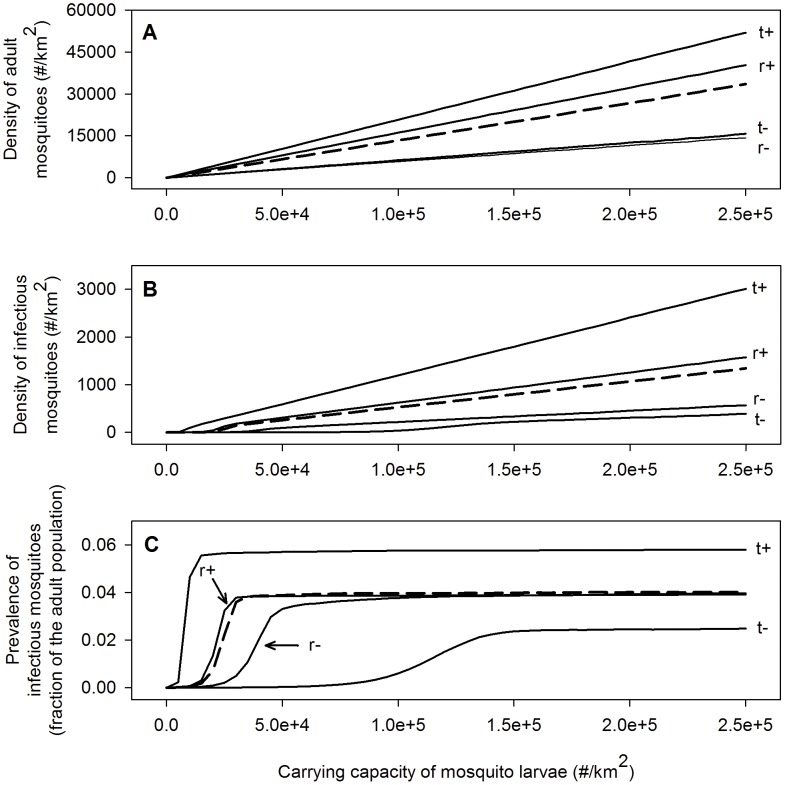
Figure 3. The mean annual densities of adult and infectious mosquitoes and the mean annual prevalence of infectious mosquitoes as a function of larval the carrying for different mid-elevation climate scenarios.
The dashed line represents a climate with a mean annual temperature of 17°C and an average yearly rainfall of 3000 mm. The other climate scenarios are derived from this scenario by increasing or decreasing the daily temperatures and rainfall. The mean annual temperatures and average yearly amounts of rainfall for these scenarios are 15.5°C and 3000 mm (t−), 18.5°C and 3000 mm (t+), 17°C and 2000 mm (r−) and 17°C and 4000 mm (r+).

