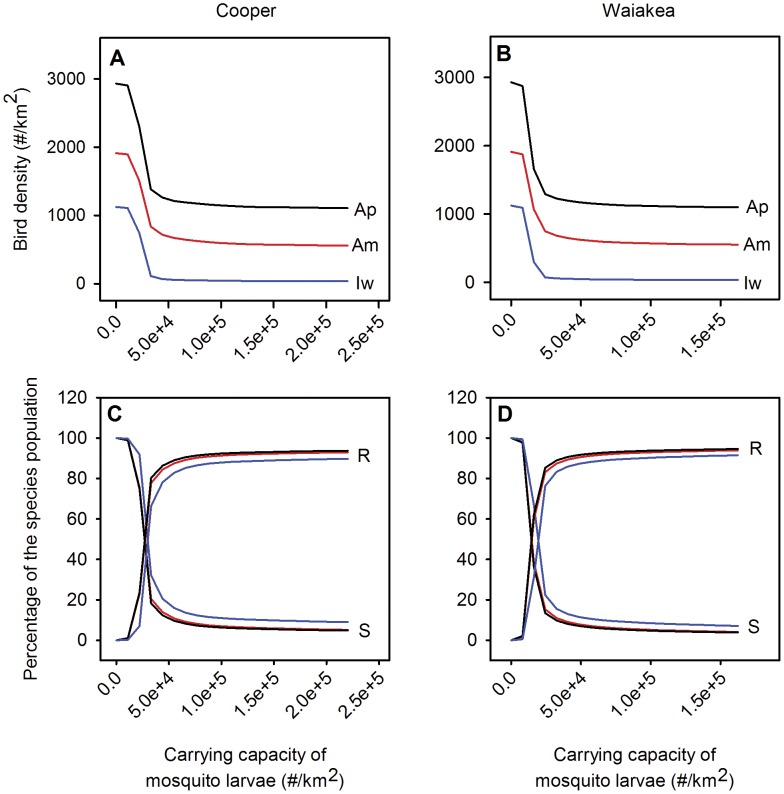
Figure 4. The mean annual densities of three Hawaiian honeycreepers and the mean annual percentages of their populations in the susceptible (S) and recovered (R or chronically-infected) stages as a function of larval carrying capacity for mid-elevation sites Cooper and Waiakea.
Am = Amakihi (red line), Ap = Apapane (black line), and Iw = Iiwi (blue line).

