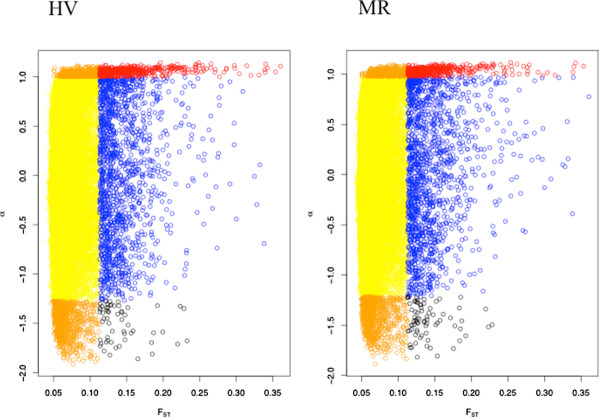
Figure 3.
Different combinations of locus-specific FSTand locus-specific α values. Yellow denotes loci with both low FST and low absolute α values (i.e., putatively neutral, undifferentiated loci). Red denotes loci with both high FST and highly positive α values. Orange denotes loci with low FST but highly negative and highly positive' α values. Blue denotes loci with high FST but low α values. Black denotes loci with high FST and highly negative α values. ‘Low’ and ‘high’ values are delimited using the quantiles of the empirical distribution. See text for details.

