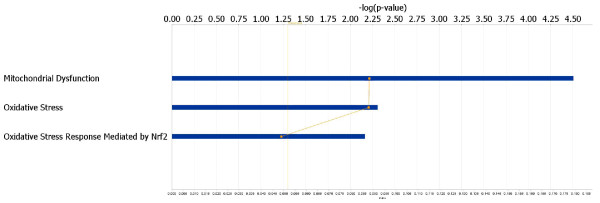
Figure 2.
Ingenuity Pathway Analysis identifies canonical pathways containing SAGE differentially expressed genes. These pathways are ranked by their statistical significance (−log p-value) which is shown along the horizontal axis. The top three pathways are depicted in this figure, and highlight the prominence of mitochondrial dysfunction and oxidative stress genes which could potentially mediate renal injury in the ROP-Os/+ mouse model.

