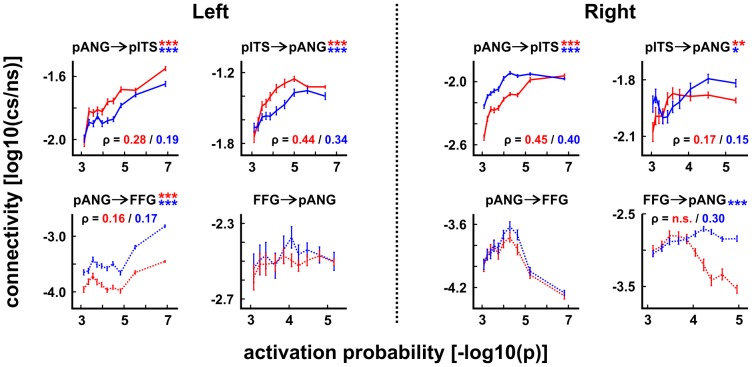
Figure 6. Surface-based cross-correlation of fMRI activation probabilities and structural connectivities.
Spatial cross-correlation plots (± SEM)1 between activation probabilities ([−log10(p)]) and structural connectivity scores ([log10(cs/ns)], with [(cs/ns)] reflecting ratios of connecting samples to the number of samples sent out from each vertex) for pANG, pITS and FFG (cf. Figure 4A), based on two samples: (n = 24) paired with functional data [red] and (n = 46) independent subjects [blue]. Connectivity ratios tend to get bound earlier at maximum values than corresponding activation probabilities. Positive correlations were slightly stronger for the sample with paired fMRI and DWI data (n = 24) compared to the independent sample from the FMRIB DWI database (n = 46; with Spearman's ρ displayed for the paired/independent sample when significant). However, the latter largely replicate and confirm generalizability of the results. 1SEM, standard error of the mean; */**/***: FWER-corrected p<0.05/0.01/0.001. pANG, posterior angular gyrus area; pITS, posterior inferior temporal sulcus; FFG, fusiform gyrus.

