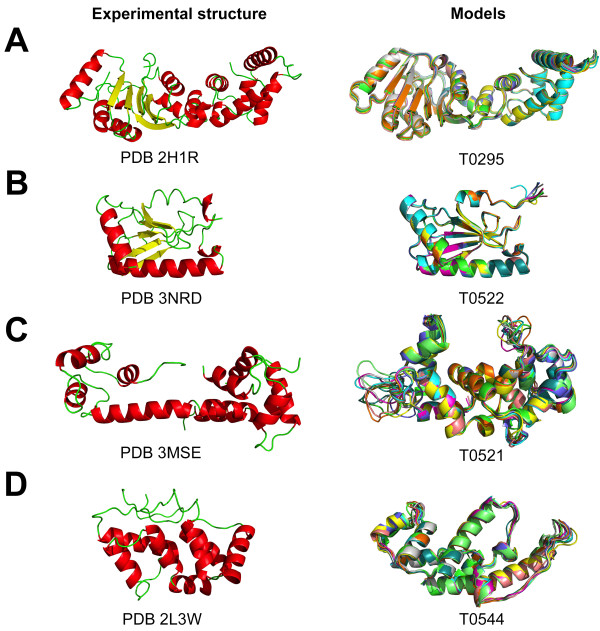
Figure 2.
Comparison of experimental structures with their respective homology models.Left side panel: experimental X-ray structures of selected CASP7 (A) and CASP9 (B, C, D) targets. Right side panel: structural overlay of ten models for each selected CASP target build with the closest available template in the protein data bank. A &B depicts “easy” modelling cases, while C &D are dramatically more challenging.

