
Figure 3.
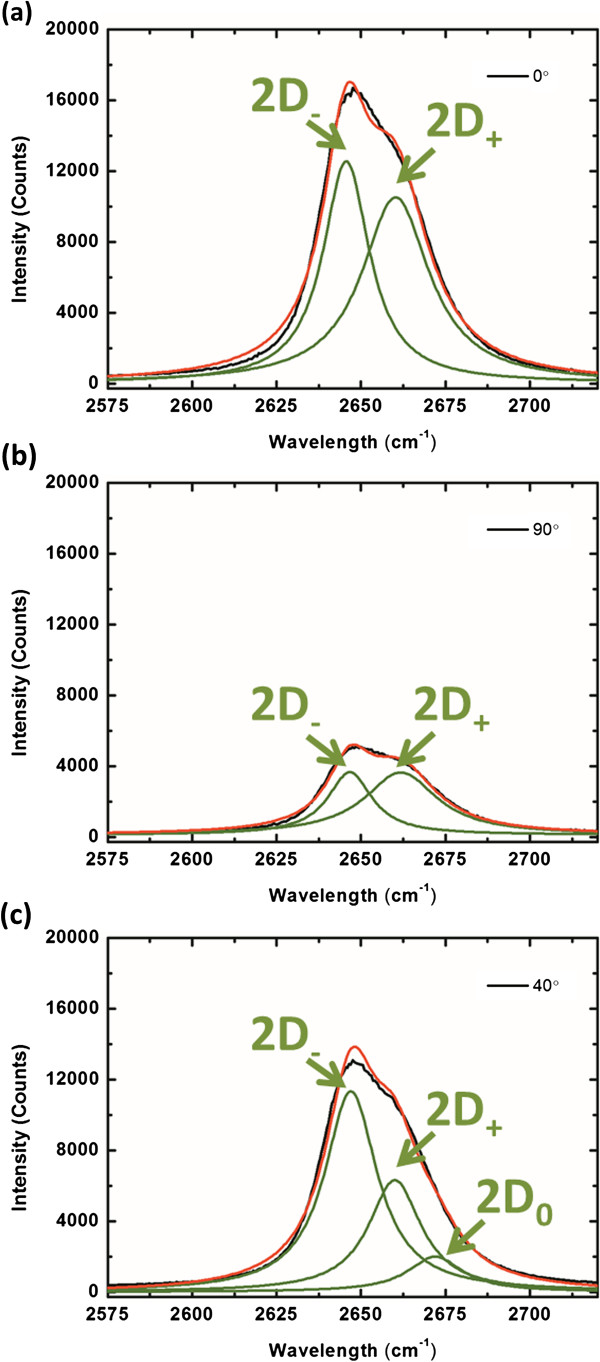
Fitting the 2D peaks with a double-Lorentzian function.Φ of (a) 0° and (b) 90°. The two angles relate to the two maximum peak positions in Figure 2, respectively. The two Lorentz peaks for (a) are at 2,646 (2D−) and 2,660 (2D+) cm−1, while that for (b) are at 2,647 (2D−) and 2,662 (2D+) cm−1. (c) For Φ of 40°, fitting the 2D peak of graphene by a triple-Lorentzian function whose three peaks correspond to the sub-modes of 2D+, 2D−, and 2D0. The green curves represent the fitting peaks for the corresponding spectra. The black curves display the spectra, while the red ones show the profiles by adding all the related fitting peaks.