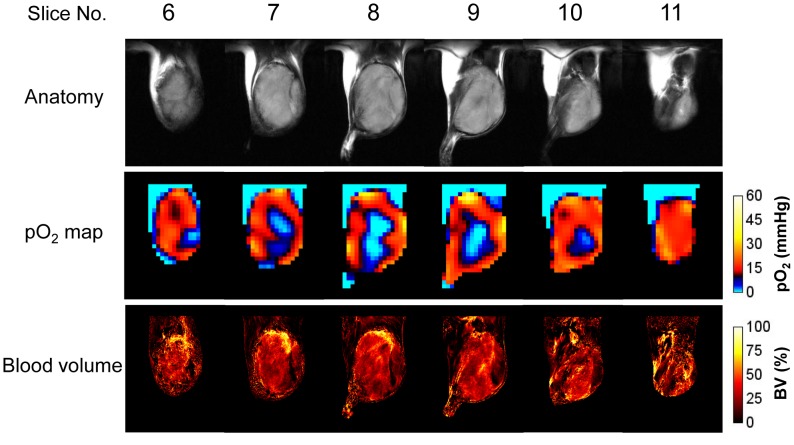
Figure 2. Anatomy, pO2, and blood volume images of SCC tumor.
T2-weighted anatomical image (top) of a SCC tumor-bearing mouse, and the corresponding pO2 maps (middle) and blood volume images (bottom) measured by EPRI and MRI. The adjacent center six slices of the 3D images were displayed, and the every slice has 2 mm thickness.

