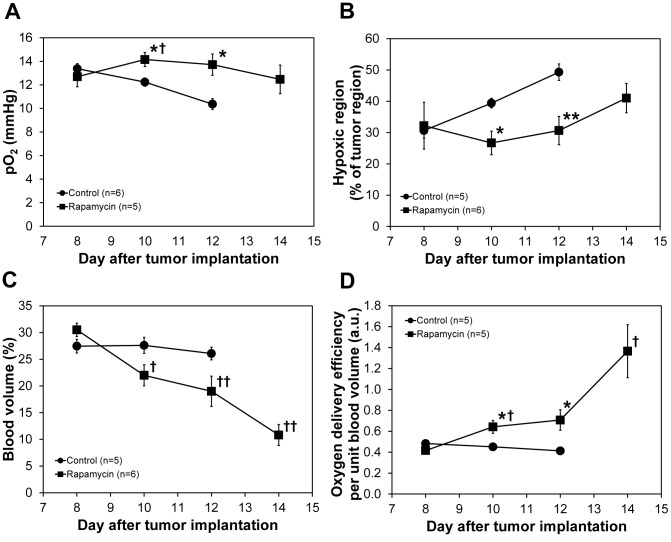
Figure 4. Changes in tumor oxygenation and blood volume.
Median pO2 values (A), percentage of hypoxic fraction (B), and mean blood volume (C) in the control and rapamycin treated SCC tumors. The values are average of 5 or 6 mice and error bars represent standard deviations. Oxygen delivery per unit blood volume (D) was calculated by dividing tumor pO2 by blood volume. * p<0.05 as compared with control, ** p<0.01 as compared with control, † p<0.05 as compared with rapamycin day 8, †† p<0.005 as compared with rapamycin day 8.

