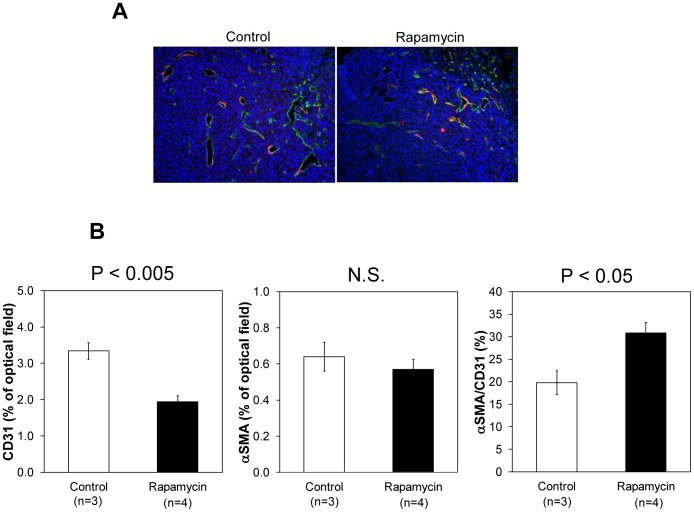
Figure 5. Immunohistochemical analysis of CD31 and αSMA in SCC xenograft.
(A) Representative images of control and rapamycin treated SCC xenograft. Green is CD31, red is αSMA, and blue is DAPI. (B) Percentage of CD31 and αSMA in the SCC tumor of control (n = 3) and rapamycin treated (n = 4, 10 mg/kg bw/day, 2 days) mice.

