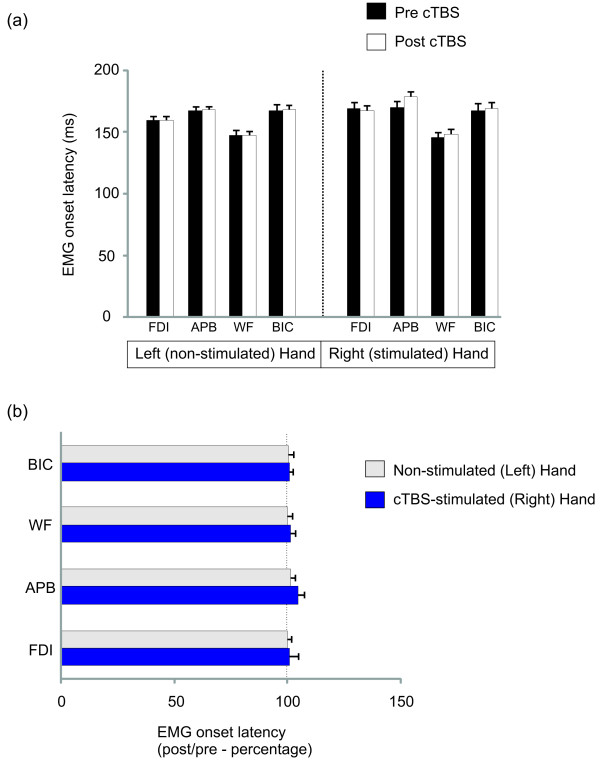
Figure 4.
EMG response latencies based on group average data (n = 14 subjects). Absolute values are depicted in the top graph (a). The graph below expresses the response onset latencies as a percentage of pre-cTBS values to demonstrate the overall lack of stimulation effect on EMG response timing (b).

