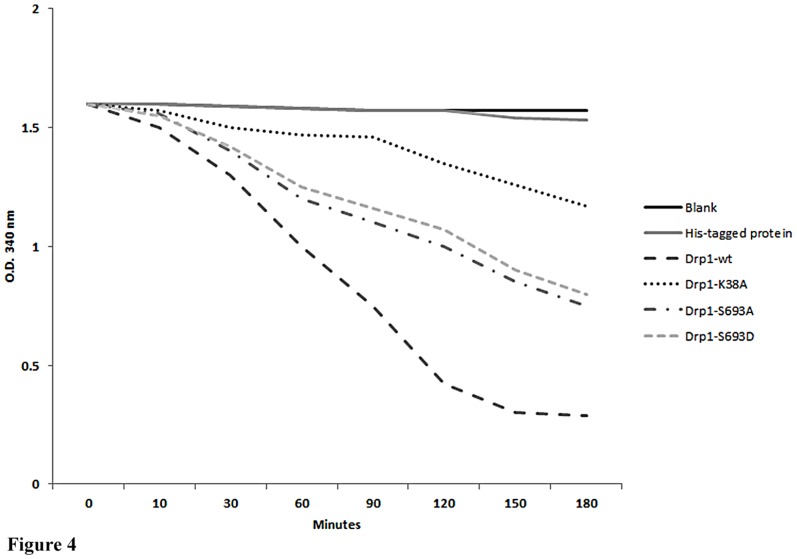
Figure 4. GTPase hydrolysis activity of Drp1mutants.
A GTPase hydrolysis activity assay was performed followed the procedures published by Ingerman and Nunnari [41]. E. coli were transformed by Drp1 mutant plasmids and 15 µg of cell lysate was applied to the assay. O.D. 340 was measured to reflect the constant of the NADH. The slope reflects the consumption of NADH. The data are representative of three independent experiments and are shown as mean values ± SD.

