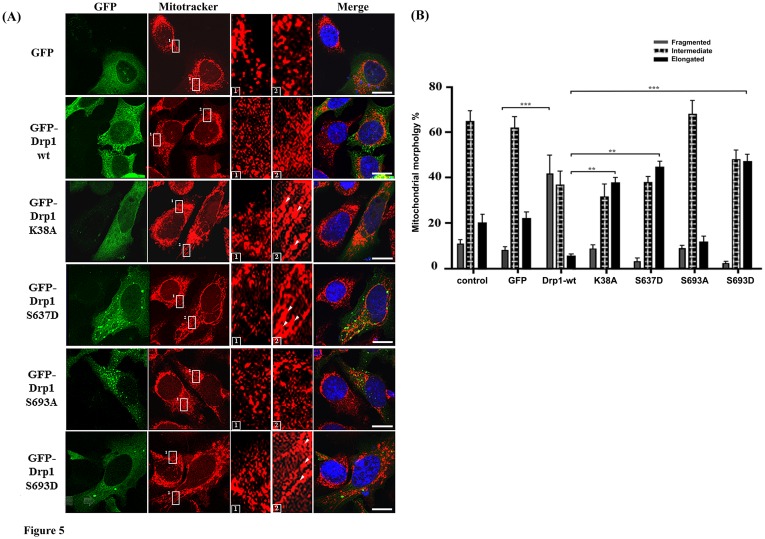
Figure 5. Mitochondrial dynamics of HeLa cells with Drp1 wt and mutants.
(A) HeLa cells were transfected with GFP-tagged Drp1 wt or other mutants for 24 hours. Mitochondrial morphology was observed by confocal fluorescent microscope with Mitotracker dye. Cell nuclei were counter-stained by DAPI. Insets are magnifications of the Mitotracker signal at the indicated areas. Inset 1 represents the non-transfected cells, and inset 2 indicates the transfected cells. Indications (white arrows) represent typical elongated mitochondria morphology. (B) Statistical result of mitochondrial morphology. After 24 hours, over 100 transfected cells were categorized into 3 groups depending on mitochondrial morphology. *p<0.05, **p<0.01, ***p<0.001.

