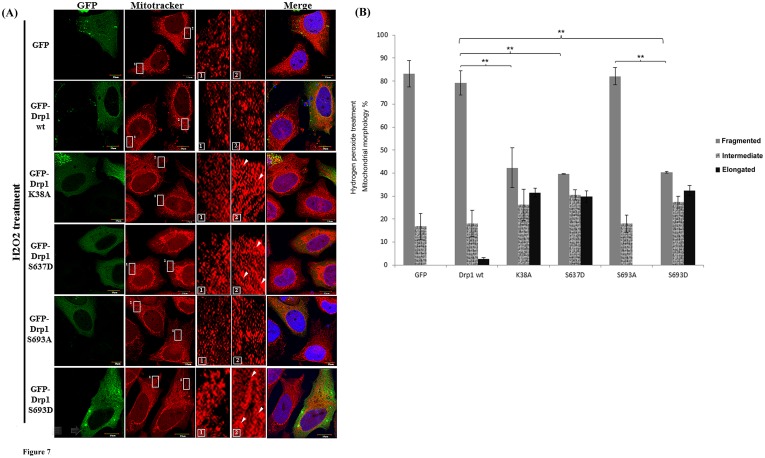
Figure 7. Mitochondrial dynamics of HeLa cells with Drp1 wt and mutants treated with H2O2.
(A) HeLa cells were transfected with GFP-tagged Drp1wt or other mutants for 24 hours. Then cells were treated with 500 µM H2O2 for another 24 hours. Mitochondrial morphology of HeLa cells was observed by staining with Mitotracker under confocal microscopy. Cell nuclei were counter-stained by using DAPI. Insets are magnifications of the Mitotracker signal at the indicated areas. Inset 1 represents the non-transfected cells, and inset 2 indicates the transfected cells. Indications (white arrows) represent typical elongated mitochondria morphology. (B) Statistical results demonstrated mitochondrial morphology of HeLa cells with or without Drp1 expression under H2O2 treatment for 24 hours; over 100 transfected cells were categorized into 3 groups depending on mitochondrial morphology. **p<0.001.

