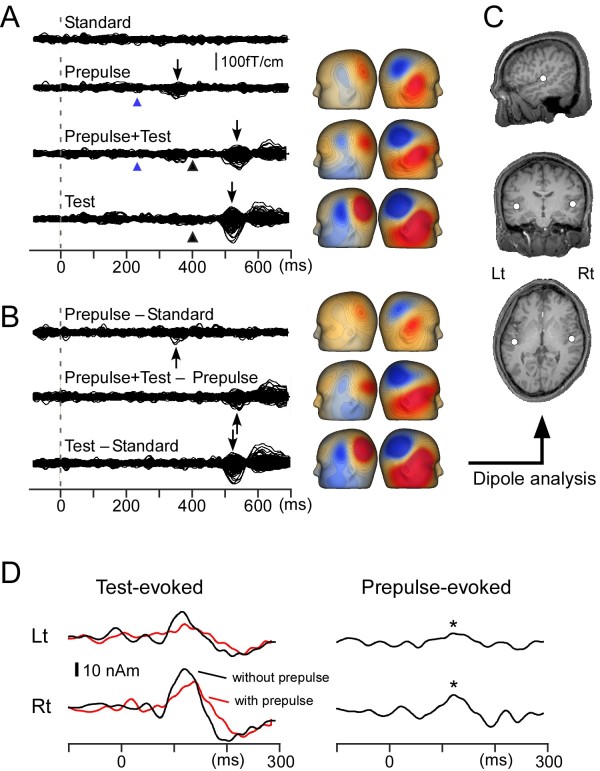
Figure 2.
Magnetic responses to the stimuli. Data from one representative subject (Subject 4) for the Standard, 3-dB prepulse alone, Prepulse + Test and Test alone stimuli. A, super imposed waveforms of all the 204 sensors. Blue and black arrowheads indicate the onset of the prepulse and the test stimulus, respectively. Isocontour maps at the peak of the main magnetic component (Change-N1m) indicated by arrows are shown. B, superimposed difference waveforms and isocontour maps at the peak. C, location of the estimated dipole for Change-N1m superimposed on the subject’s own MR images. D, time course of the source strength waveform of the Test-evoked response (left) and Prepulse-evoked response (right). Black and red lines for the Test-evoked response indicate a source strength waveform for the test response following the Test-alone and Prepulse + Test stimulus, respectively. Based on the criteria used in this study, the Prepulse stimulus evoked a significant response (indicated by asterisks).

