Figure 2.

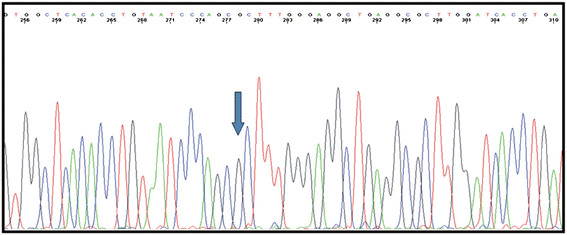
Breakpoint sequencing analysis. Eletropherogram showing the g.29197_65577del36381 mutation in the BRCA1 sequence; the intron 8 sequence is followed by intron 19 sequence. The blue arrow represents the inferred breakpoint.

Breakpoint sequencing analysis. Eletropherogram showing the g.29197_65577del36381 mutation in the BRCA1 sequence; the intron 8 sequence is followed by intron 19 sequence. The blue arrow represents the inferred breakpoint.