
Figure 2.
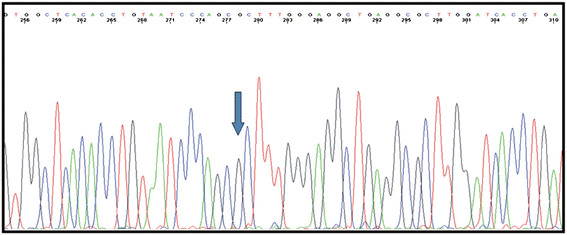
Breakpoint sequencing analysis. Eletropherogram showing the g.29197_65577del36381 mutation in the BRCA1 sequence; the intron 8 sequence is followed by intron 19 sequence. The blue arrow represents the inferred breakpoint.
Official websites use .gov
A
.gov website belongs to an official
government organization in the United States.
Secure .gov websites use HTTPS
A lock (
) or https:// means you've safely
connected to the .gov website. Share sensitive
information only on official, secure websites.
Breakpoint sequencing analysis. Eletropherogram showing the g.29197_65577del36381 mutation in the BRCA1 sequence; the intron 8 sequence is followed by intron 19 sequence. The blue arrow represents the inferred breakpoint.