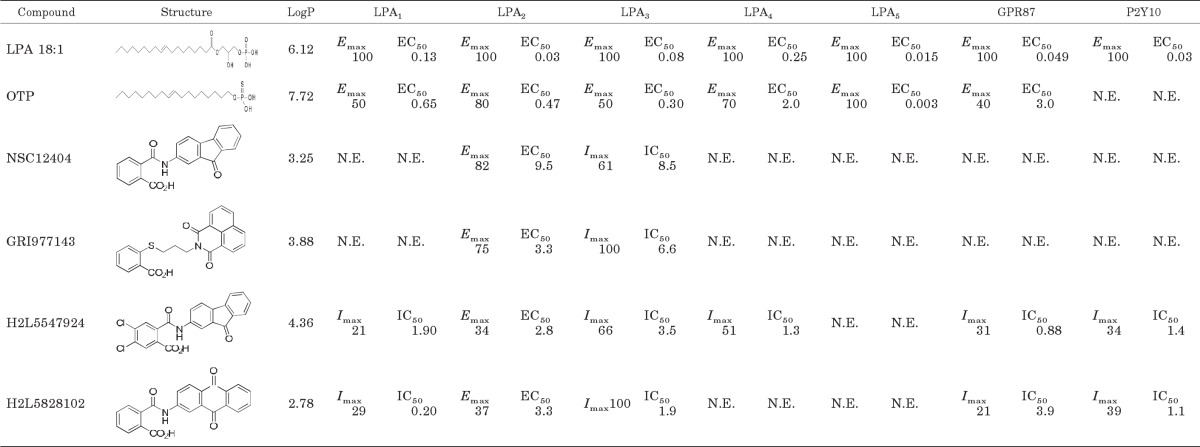
TABLE 1.
LPA receptor-activated Ca2+ mobilization profiles for hit compounds
Every compound was tested on every receptor subtype for agonist activity up to 10 μM and the Emax value listed in the table is normalized to the maximal response of LPA 18:1 at 10 μM. Those compounds that failed to activate a given receptor were tested for inhibition of the LPA 18:1 response. Imax is percentage inhibition of the ∼Emax75 LPA 18:1 response for a given receptor subtype using a 10 μM concentration of the antagonist. EC50 and IC50 concentrations are given as micromolar concentrations for dose-response curves covering the 30 nM to 10 μM range (Fig. 1). For determination of IC50 values, dose-response curves were generated using the ∼Emax 75 concentration of LPA 18:1 for a given LPA receptor subtype, and the ligand was coapplied in concentrations ranging from 30 nM to 10 μM.
LogP, log partition coefficient; N.E., no effect up to 10 μM of the ligand, the maximal concentration tested in the present experiments.

