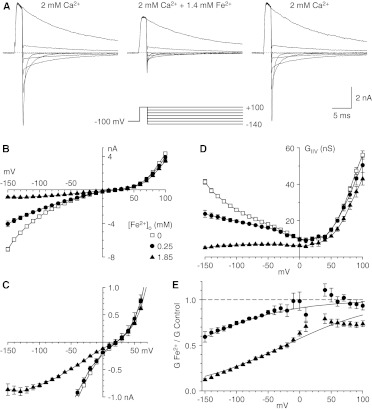
Fig. 1.
Block by Fe2+ of currents carried by Ca2+ with the II-V protocol. A, sample currents recorded by using the protocols illustrated below the middle records, under control conditions (left), after the addition of Fe2+ (middle), and after washout of Fe2+ (right) (3-kHz Gaussian filter). Currents are shown in 40-mV increments. B, II-V relationships from the protocol used in A, under control conditions (0 mM Fe2+) and with two concentrations of Fe2+ (n = 4 for each concentration). C, expanded view of II-V relationships. D, chord conductances calculated for the data in B. E, inhibition by Fe2+, expressed as the ratio of the chord conductance with Fe2+ to the chord conductance under control conditions. Data are not shown near the reversal potential, where errors in conductance calculations can be large. Solid curves, fits to the model described by Woodhull (1973). Symbols shown in B apply to B to E.

