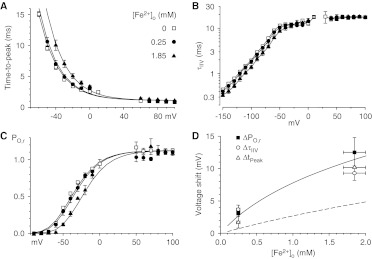
Fig. 3.
Effects of Fe2+ on gating. A, effects of Fe2+ on the time to peak currents with the I-V protocol. B, effects of Fe2+ on the time constants for deactivation with the II-V protocol. C, effects of Fe2+ on channel activation, determined as the ratio of the peak I-V current to the II-V current at the same voltage. D, voltage shifts for the data shown in A to C, for the activation curve (ΔPO,r), for deactivation (ΔτIIV), and for time to peak (ΔtPeak). Solid curve, fit to the Gouy-Chapman-Stern theory. Dashed curve, fit to voltage shifts induced by Ca2+, Ba2+, and Mg2+ (Khan et al., 2008). Symbols shown in A apply to A to C. Data near the reversal potential are not shown in A to C (same cells as Figs. 1 and 2).

