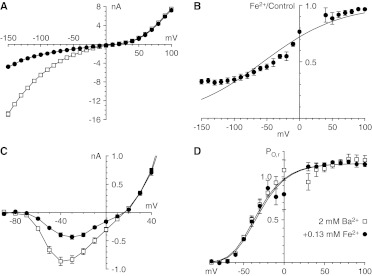
Fig. 5.
Analysis of effects of Fe2+ with 2 mM Ba2+. A, II-V relationships under control conditions and with 0.13 mM Fe2+. B, inhibition by Fe2+, determined as chord conductance ratios (Fe2+/control) and fitted to a Woodhull model. C, I-V relationships (currents from 50 to 100 mV not shown). D, activation curves determined from I-V/II-V current ratios. Data near the reversal potential are not shown in B and D (n = 4 for all panels).

