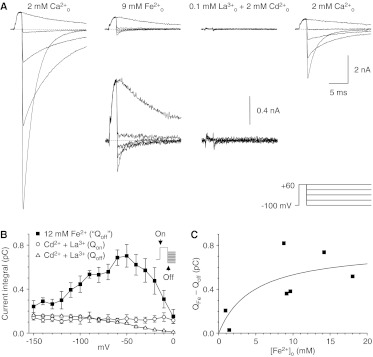
Fig. 7.
Comparison of tail currents with Fe2+ with gating currents. A, sample records with the II-V protocol, in 40-mV increments. Partial recovery (right) after superfusion with the solution used to isolate gating currents (La3+ plus Cd2+) should be noted. Insets below the middle records, recordings on a 5× expanded scale, to show tail currents with Fe2+ and on- and off-gating currents with La3+ plus Cd2+ (3-kHz Gaussian filter). B, integrated tail currents with Fe2+, compared with the on-gating current (measured during depolarization to 60 mV) and off-gating current (measured after repolarization) (Fe2+ tails, n = 5; on- and off-gating currents, n = 4). C, portion of the integrated tail current amplitude attributable to Fe2+ entry, as a function of Fe2+, for the five cells in B and two cells tested with ∼1 mM Fe2+. Solid curve, fit to a single saturable binding site with a KD of 4.7 mM and a maximal current of 0.78 pC.

