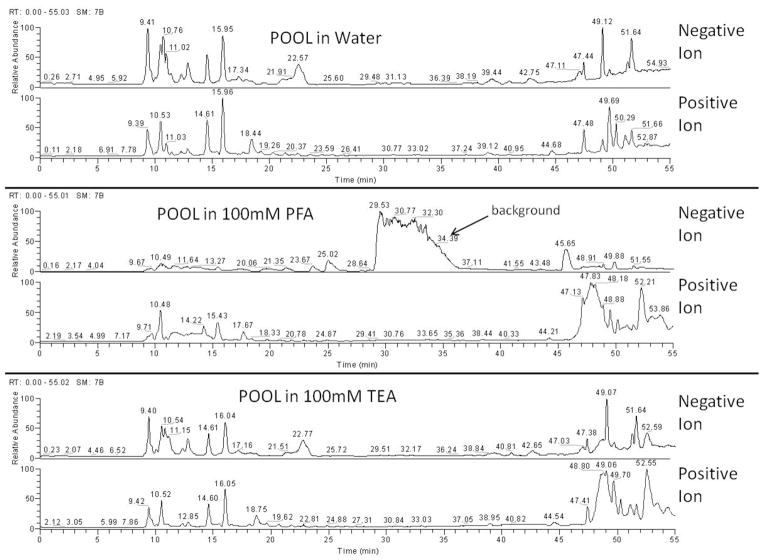
Figure 2.
Comparison of Ion-Pairing Reagents for LC-MS Analysis. The top two chromatograms show the LC-MS separation and detection of plasma extractions dissolved in water and detected via negative ion (upper trace) and positive ion (lower trace) full scan profiling. The center pair shows the LC-MS analysis of extracts dissolved in 100 mM PFA, and the bottom pair is for the extracts dissolved in 100mM TEA.

