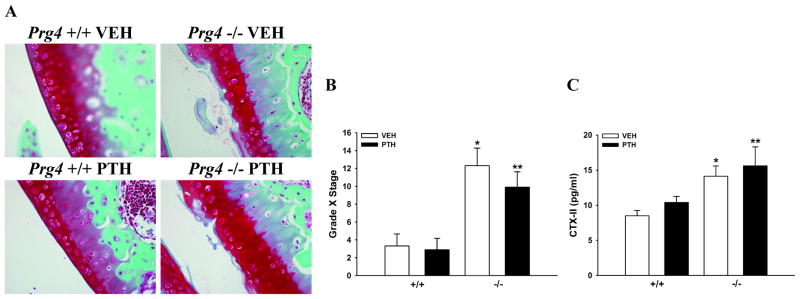
Figure 3.
Articular cartilage degradation. A: Representative images of Safranin O-fast green stained articular cartilage (40X) in sagittal knee sections. B: Bar graph represents the OARSI score (Grade X Stage) for the articular cartilage in the tibial plateau (n=8–10/gp). *p<0.01 vs. +/+ VEH; **p<0.01 vs. +/+ PTH. C: Bar graph represents serum C-terminal telopeptides of type II collagen (CTX-II) levels (n=8–10/gp). *p<0.01 vs. +/+ VEH; **p=0.08 vs. +/+ PTH.

