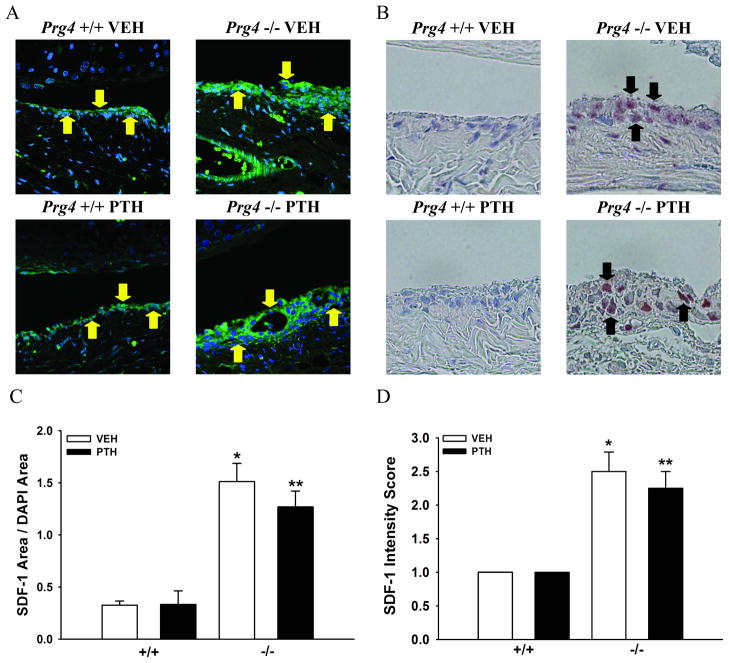
Figure 5.
Synovium SDF-1 expression. A: Representative images of stromal cell-derived factor-1 (SDF-1) immunofluorescence labeled synovium (60X) (SDF-1/Green and DAPI/Blue) (yellow arrows indicate SDF-1+ synovium) in sagittal knee sections. B: Representative images of SDF-1 immunohistochemistry labeled synovium (60X) (SDF-1/Brown) (black arrows indicate SDF-1+ synovial cells) in sagittal knee sections. C: Bar graph represents SDF-1 area/DAPI area in the synovium (n≥4/gp). *p<0.001 vs. +/+ VEH; **p<0.01 vs. +/+ PTH. D: Bar graph represents synovial cell SDF-1 intensity score (n=4/gp). *p<0.05 vs. +/+ VEH; **p<0.05 vs. +/+ PTH.

