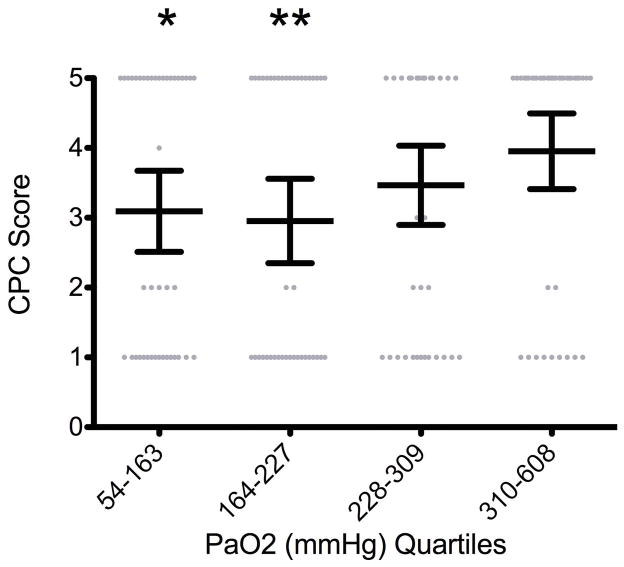
Figure 5. CPC Score at Hospital Discharge by PaO2 Quartiles.
There was no statistically significant association between increasing PaO2 and a change in CPC score (p = 0.08); however quartiles 1 and 2 had significantly better CPC scores at discharge than quartile 4 (p = 0·038* and 0·018**, respectively). Values are means (middle long horizontal line) and standard deviations (SD: upper and lower caps).

