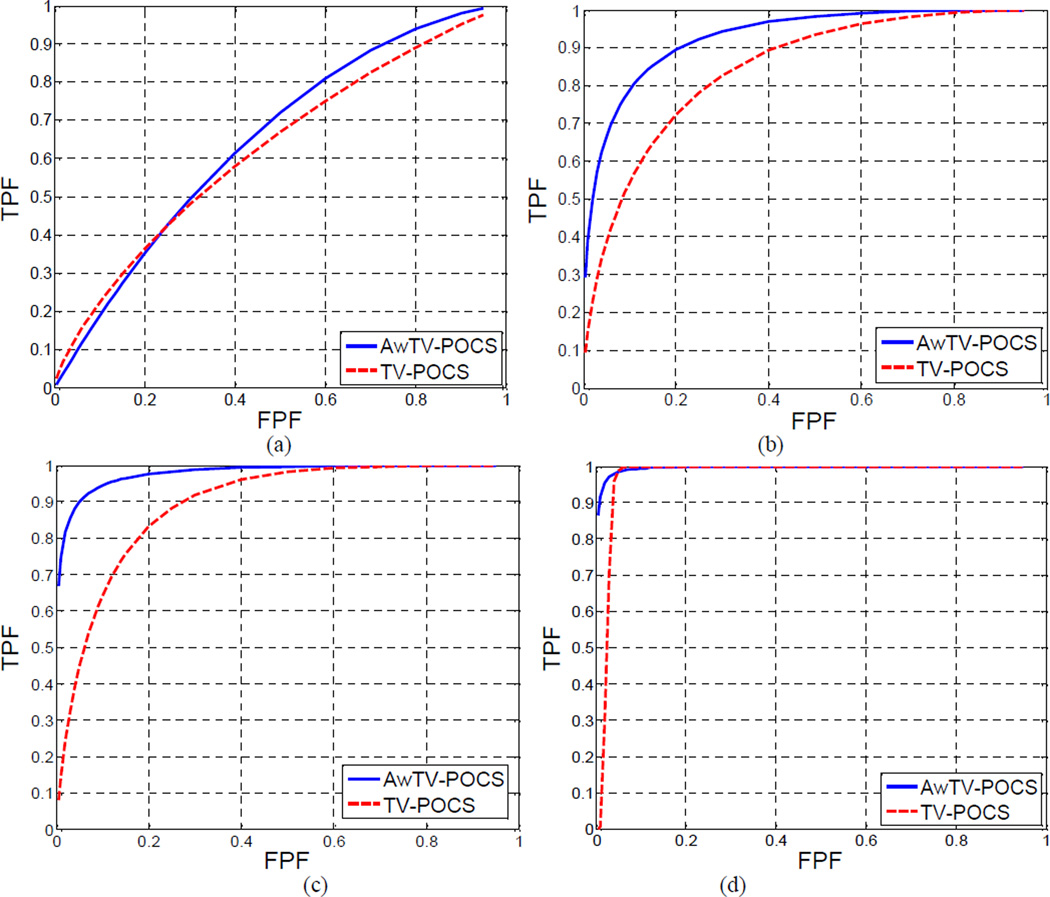
Figure 24.
The ROC curves of the two algorithms: AwTV-POCS and TV-POCS. Graph (a) shows the ROCs for the lesion with 1.5% contrast level. Graph (b) shows the ROCs for the lesion with 3% contrast level. Graph (c) shows the ROCs for the lesion with 4.5% contrast level. Graph (d) shows the ROCs for the lesion with 4.5% contrast level.

