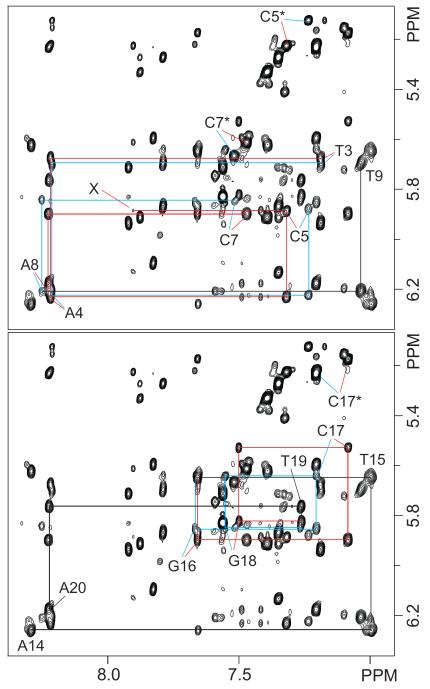
Figure 2.
Contour plots of an expanded region of an 800 MHz NOESY spectrum (300 ms mixing time) recorded at 25 °C in 100% D2O buffer. The figure shows intra residue and sequential base (purine H8/pyrimidine H6) to sugar H1′ proton interactions for the modified (top) and unmodified (bottom) strands on the central (T3 T9)•(A14 A20) segment of the cFapy-dG•dC duplex. Red and blue colors trace these connectivities on the Z and E isomeric duplexes, respectively. Numbered letters label the intra residue NOE peaks and asterisks indicate cytosine(H5 H6) peaks. X identifies the F6(HCO) C5(H1′) NOE of the Z isomer.

