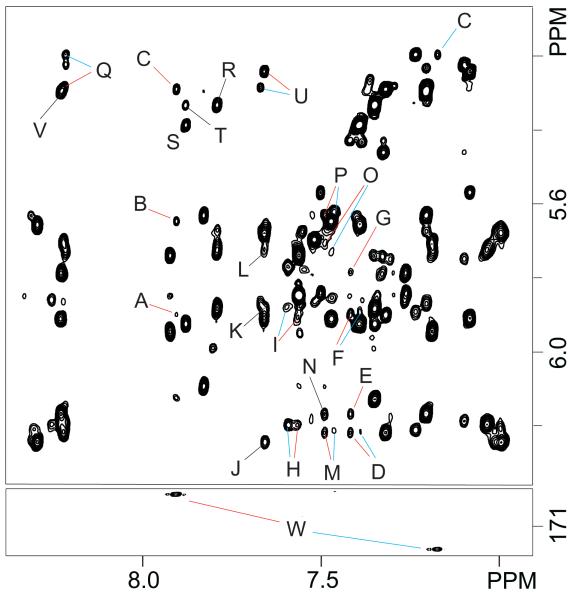
Figure 3.
The top panel depicts additional NOE interactions on the region shown in Figure 2. Red and blue colors differentiate the Z and E isomeric duplexes, respectively. Labeled peaks are assigned as follows: A, F6(HCO) C5(H1′); B, F6(HCO) C7(H5); C, F6(HCO) C5(H5); D, A4(H2) A4(H1′); E, A4(H2) A20(H1′); F, A4(H2) C5(H1′); G, A4(H2) T19(H1′); H, A8(H2) A8(H1′); I, A8(H2) G16(H1′); J, A14(H2) A14(H1′); K, A14(H2) G10(H1′); L, A14(H2) T9(H1′); M, A20(H2) A4(H1′); N, A20(H2) A20(H1′); O, A20(H2) T3(H1′); P, A20(H2) C21(H1′); Q, A4(H8) C5(H5); R, G10(H8) C11(H5); S, G12(H8) C13(H5); T, G12(H8) C11(H5); U, G16(H8) C17(H5); V, A20(H8) C21(H5). Bottom, expanded region of an 800 MHz [1H 13C] HSQC spectrum recorded at 25 °C that was to identify the formyl group of each cFapy-dG isomer by the F6(HCO) F6(CO) interaction (peaks labeled W).

