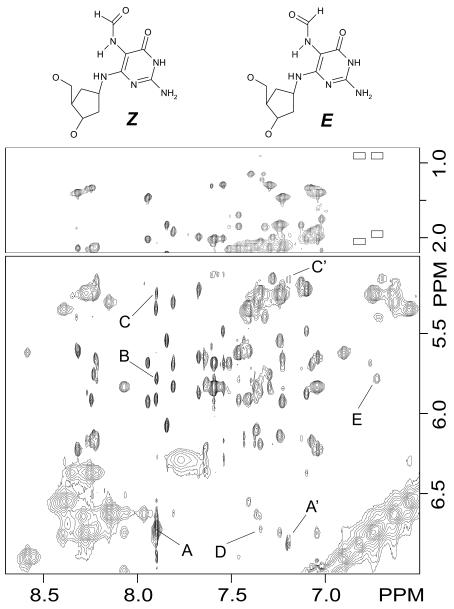
Figure 5.
The figure shows contour plots of the same NOESY experiment shown in Figure 4, depicting interactions between the base/amino and methyl (top), and base/amino and sugar H1′ (bottom) proton regions of the spectrum. Labeled peaks are assigned as follows: A, Z F6(HCO) F6(N5H); A’, E F6(HCO) F6(N5H); B, Z F6(HCO) C5(H1′); C, Z F6(HCO) C5(H5) and C’, E F6(HCO) C5(H5); D, Z F6(N5H) C5(H6); E, Z F6(N5H) C5(H1′).

