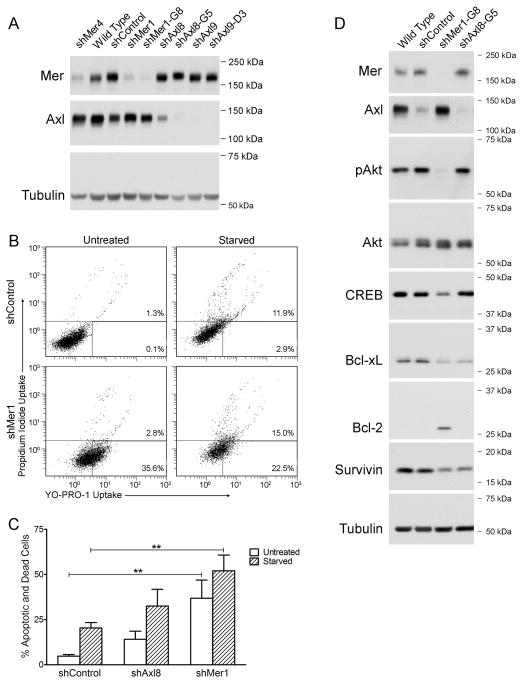
Figure 3. Mer inhibition increases apoptosis and inhibits pro-survival signaling in NSCLC cells.
(A) Whole-cell lysates of the indicated A549 cell lines were subjected to western blot analysis using anti-Mer and anti-Axl antibodies. Tubulin was used as a loading control. Blots representative of at least three independent experiments are shown. (B) Representative scatter plots of Mer-knockdown (shMer1) and shControl A549 cells incubated in the presence (Untreated) or absence (Starved) of 10% fetal bovine serum for 1–5 hours. Apoptotic and dead cells were identified by flow cytometric analysis of cells stained with YO-PRO-1 and propidium iodide. The percentages of apoptotic (bottom right) and dead cells (top) are shown. (C) Cumulative data demonstrate a significant accumulation of apoptotic and dead cells when Mer expression is reduced (** P < 0.01 vs shControl, 2-way repeated measures ANOVA followed by Bonferroni posttests, n = 12). Mean values and standard errors are shown. (D) Wild type, shControl, shMer1-G8, and shAxl8-G5 A549 cells were cultured in serum-free medium for two hours to mimic the experimental conditions in panels B and C. Whole-cell lysates were subjected to western blotting with antibodies against the indicated proteins. Tubulin was used as a loading control. Blots representative of three independent experiments are shown.

