Figure 4.

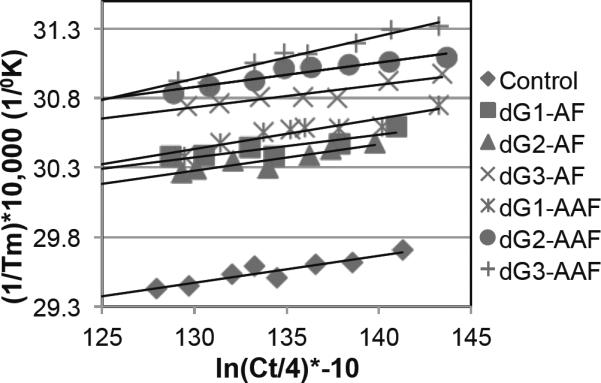
Van't Hoff plots of Tm−1 versus ln(Ct/4) derived from the melting curves for the control, dG-AF and dG-AAF 12mer duplexes (at concentrations between 2 and 11μM). Ct represents the total oligonucleotide concentration
Yeo et al.,

Van't Hoff plots of Tm−1 versus ln(Ct/4) derived from the melting curves for the control, dG-AF and dG-AAF 12mer duplexes (at concentrations between 2 and 11μM). Ct represents the total oligonucleotide concentration
Yeo et al.,