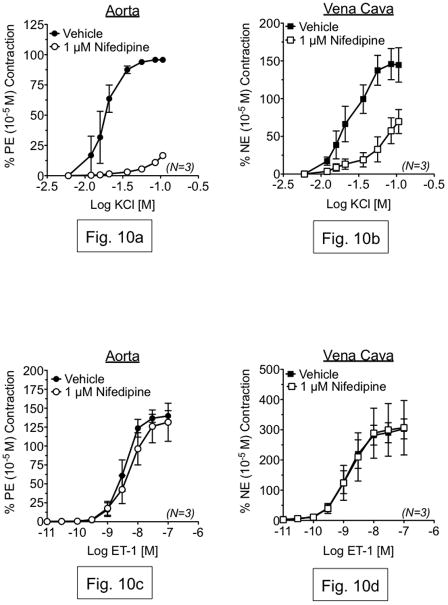
Figure 10.
Top: Measurement of KCl-induced contraction in aorta (a) and vena cava (b), exposed to vehicle or nifedipine (1 μM). Bottom: Measurement of ET-1-induced contraction in aorta (c) and vena cava (d), exposed to vehicle or nifedipine (1 μM). In (ad), vehicle or antagonists were incubated with tissue for 1h prior to agonist exposure. Points represent mean ± SEM for the number of animals indicated in parentheses. * = p<0.05 versus vehicle.

