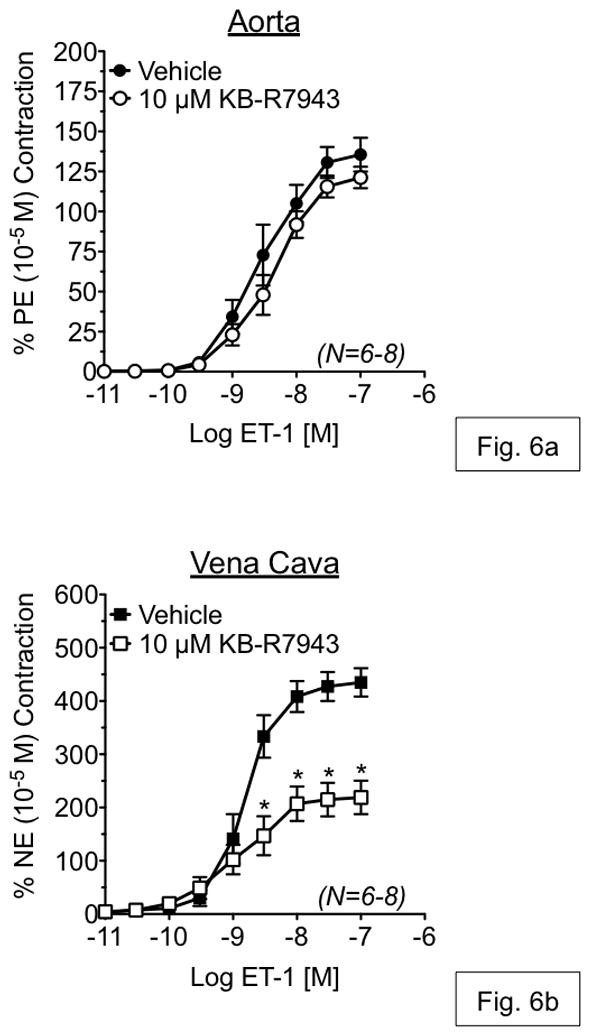
Figure 6.

Measurement of endothelin-1-induced responses in aorta (a) and vena cava (b), exposed to vehicle or KB-R7943 (1 μM). Vehicle or antagonists were incubated with tissue for 1h prior to ET-1 exposure. Points represent mean ± SEM for the number of animals indicated in parentheses. * = p<0.05 versus vehicle.
