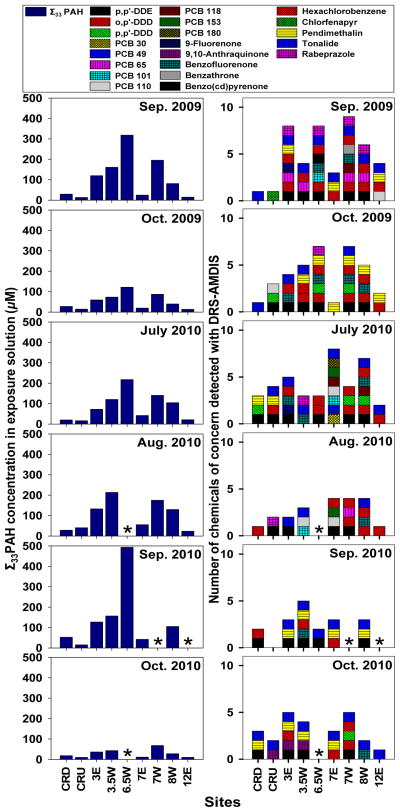
Figure 2. Chemical characterization of PSD extracts from Portland Harbor.
The concentrations of the sum of 33 PAH analytes in the highest dose (100X) exposure solutions used in the zebrafish bioassay is shown on the left. The number of chemicals of concern that were identified in samples from each site and sampling event are shown on the right. The colors/patterns of the blocks indicate which chemicals were identified in the samples. Asteriscs indicate when samples were not obtained.

