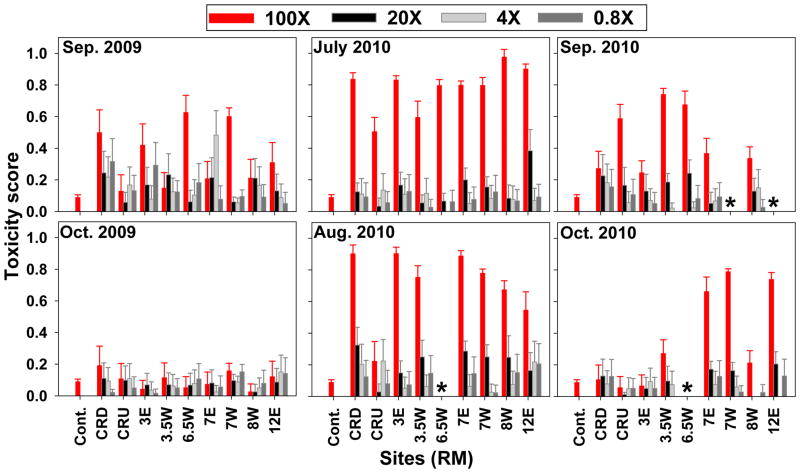
Figure 4. Developmental toxicity of PSD extracts.
The developmental toxicity of each sample was scored based on the presence or absence of 21 toxic outcomes. Bars represent the average score of all embryos exposed to the sample (n=40 per treatment) and lines represent the standard deviation. Scores range from 0–1 where 0 is indicative of normal development and 1 represents mortality at the earliest time point. The highest concentration (100X; red bars) was 1% PSD extract and the other exposure concentrations are successive five-fold dilutions of the extract (20X, 4X and 0.8X). The average outcome of the 1% DMSO control (Cont.) is shown on each graph for comparison. Asterisks indicate that samples were not obtained from the field. See Figure 2.1 for the location of the sampling sites.

