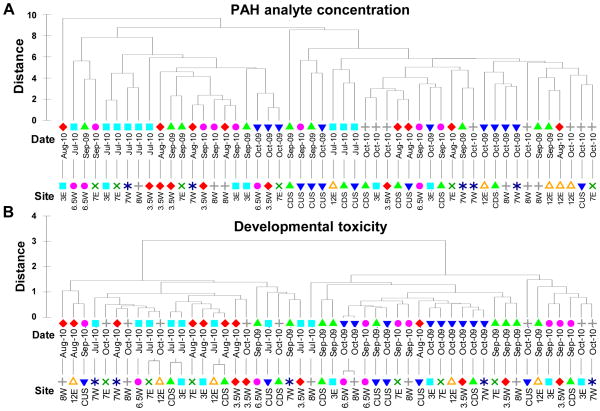
Figure 6. Dendograms of MDS results for chemical and toxicity characteristics of environmental samples.
Dendograms show the similarity of samples to one another in terms of PAH analyte concentrations (A) and developmental toxicity (B). Distance is a high-dimensional measure of similarity between samples with multiple variable measurements. PAH similarity matrices were constructed using the concentrations of all quantified analytes at the highest exposure concentration and data were normalized prior to analysis. The developmental toxicity similarity matrices were constructed from the percent incidence of each observed developmental endpoint in embryos exposed to the highest concentration PSD extract solution. The sampling date and site labels for each sample are shown; symbols are a visualization guide only and repetition of symbols between date and site labels does not indicate an association.

