Figure 1.

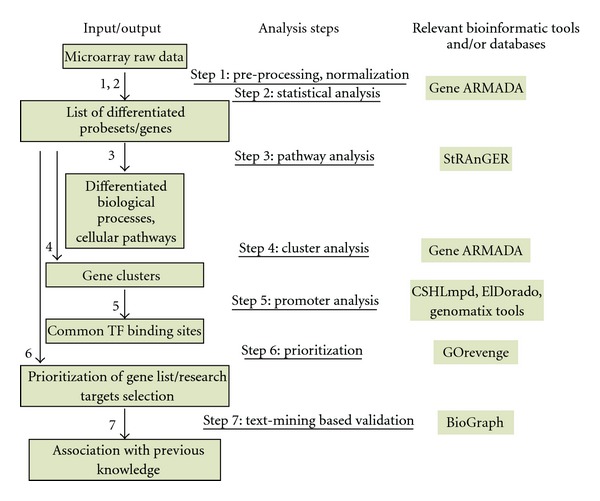
Schematic representation of the proposed workflow. Arrows depict the various analysis steps. The bioinformatic tools and databases used for the implementation of each step are also shown.

Schematic representation of the proposed workflow. Arrows depict the various analysis steps. The bioinformatic tools and databases used for the implementation of each step are also shown.