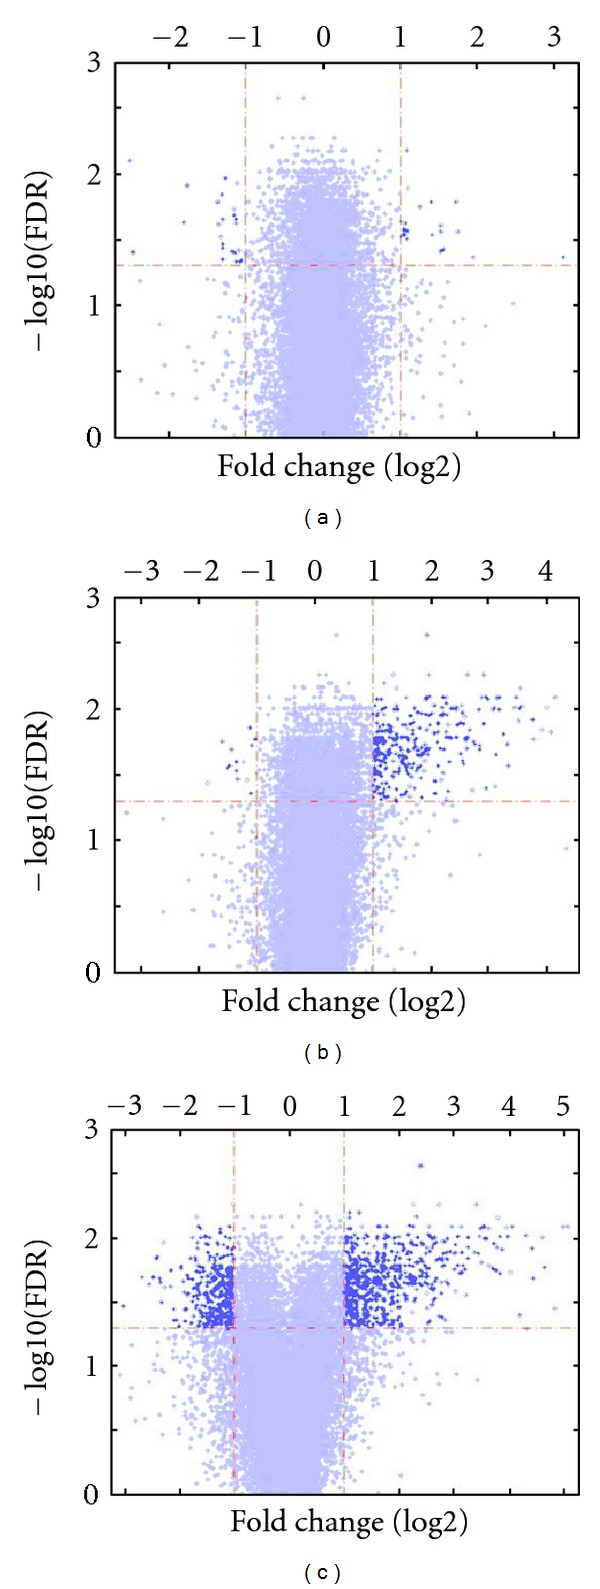
Figure 2.

Volcano plots of the gene list as yielded by ANOVA. Each panel represents filtered and normalized data from each experimental condition (3, 6, and 78 weeks old mice). The horizontal axes depict the fold change ratio between ApoE deficient and wild type mice, for each age in log2 scale, while the vertical axes represent statistical significance by depicting the −log10 (FDR).
