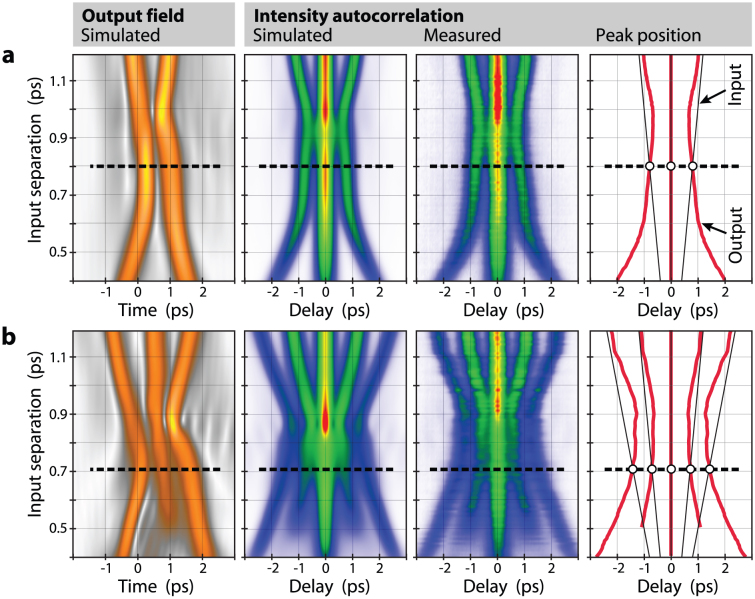
Figure 3. Study of temporal structure of (a) double and (b) triple pulses.
The temporal separation of pulses at launch is varied (vertical axes), and the resulting output profiles are recorded. Color scale indicates power levels. From left to right: Simulated temporal profile; same but self-convoluted for autocorrelation; measured autocorrelation profile; same but maxima extracted for better visibility, with auxiliary lines indicating positions in the absence of interaction. The equilibrium distances are highlighted by dashed horizontal lines; equilibrium positions are marked as circles in the right panels.

