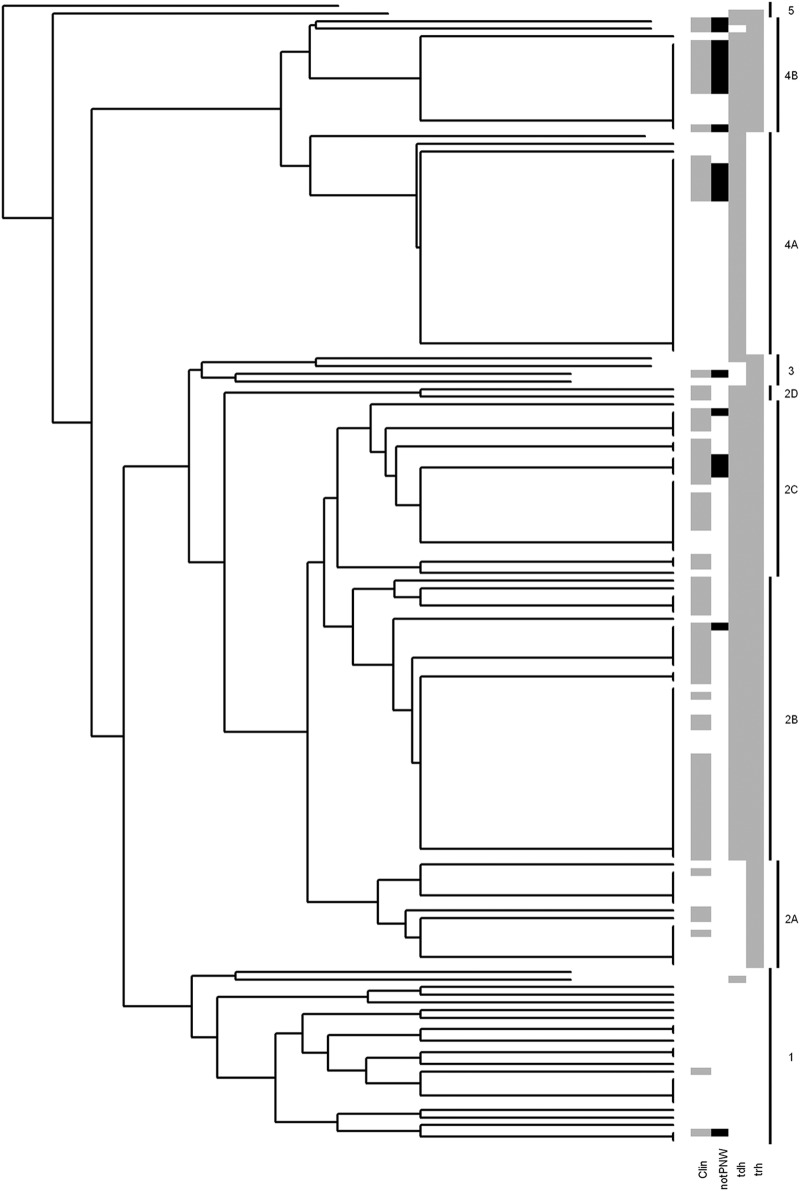
Fig 1.
Dendrogram of V. parahaemolyticus strains generated by hierarchical clustering analysis. The analysis separated the strains into 2 large clusters (2 and 4) and 3 smaller clusters (1, 3, and 5). The gray shading denotes the clinical isolates (Clin) in the clusters, while black denotes clinical isolates from other geographic regions (notPNW). The proportions of tdh+ and trh+ strains in each cluster are also denoted in gray.

